Neville Li Research
  • Home
  • Research
    • Services Available
    • Recommended Resources
    • Free Webinars >
      • Introduction to Using MAXQDA to Enhance Research Rigor (Starter)
    • Archives
    • Blog
    • Contact
  • MAXQDA Monthly Online Workshop 2023
    • MAXQDA Monthly Online Workshop - September 2023
    • MAXQDA Monthly Online Workshop - October 2023
    • MAXQDA Monthly Online Workshop - November 2023
    • MAXQDA Monthly Online Workshop - December 2023
  • MAXQDA Monthly Online Workshop - Weekend
    • MAXQDA Advanced Coding-Analysis Workshop - August 2023
    • MAXQDA Monthly Online Workshop - Weekend September 2023
    • MAXQDA Monthly Online Workshop - Weekend October 2023
    • MAXQDA Monthly Online Workshop - Weekend November 2023
    • MAXQDA Monthly Online Workshop - Weekend December 2023
  • Group Training
    • MAXQDA Group Training
    • NVivo Online Workshop

4 Tips for Effective Teamwork Using Qualitative Data Analysis (QDA) Software

6/12/2020

0 Comments

 
Over the years, one area that I have seen users of QDA software struggle with is how to work in teams, precisely, what decisions to make about teamwork that would result in the most rigorous analyses while being efficient (that means not wasting time). I found very few resources available to guide people through this. As such, I share some key recommendations that researchers working in teams are encouraged to adopt.
 
1. Set up a project with the same documents before commencing teamwork
When researchers work in teams, a common method is to create different copies of the same project, send it to all team members who will do work on it, and later merge the projects into a master file. It is extremely important to understand that most QDA software recognize a document by its characters such as letters, numbers and spaces. For the merging process to work, the software has to “know” that the source documents in different projects are the same, otherwise they will be added to the master file, not merged. Therefore, if you are working in teams, please DO NOT edit the documents even if you spot errors in them. Once the documents have been imported into a QDA software, leave them as they are.
 
2. Come up with a coding framework/structure outside of the software before commencing teamwork
Some teams like to allow individual researchers to add or remove codes in the code system as they work on their copy of the project. If you take this approach, it is entirely rigorous but will take more time to merge and clean up the code system later. Another more time-efficient approach is to first have team meetings to discuss a coding framework, then create one standard framework in the software. That means everyone on the team is working with the same coding framework, without the permission to add, remove, rename, or merge codes. This will save you plenty of time spent on cleaning up the code system if every team member creates their own code system and you merge them later.
 
3. Team members working on the same documents or separate documents? – It’s your call
This is a methodological consideration researchers need to decide for their projects. What I recommend is that if you do not plan on comparing intercoder agreement percentages and/or Kappa scores, the most efficient method is to assign different team members to work on different documents. That means researchers are not coding the same documents. As team members only work on some documents out of the total, it will take a much shorter time to finish coding or analyzing all documents, and then all separate projects can be merged into a master project. However, if you are comparing your understanding of the data by way of intercoder agreement and/or Kappa score, there is no way to get around having different members code the same documents. In this case, please ensure every researcher is logged on using their unique user name or initials; this way the QDA software can present you with the numbers and also tell you who did what in the master file.
 
4. Consider using the User Management functions in your software program
Different software have its built-in functions to manage the teamwork process, although they are commonly ignored by users. You can always search in the user manual for these functions that could be called user management, access control, password setup, or logbook. They allow you to create a password to limit access to the project that you will share with multiple teammates, assign specific tasks to individuals, and check who did what in the standalone projects as well as in the master file. These functions are specifically created to help you work in teams.
 
These tips for working in teams are not the official Must Do procedures from any guidebook, but my personal Ought To steps that have been proven to enhance both the effectiveness and efficiency in teamwork using QDA software. I hope you find them useful.
0 Comments

5 Tips for Conducting Community-Based Participatory Research

12/31/2019

0 Comments

 
Picture
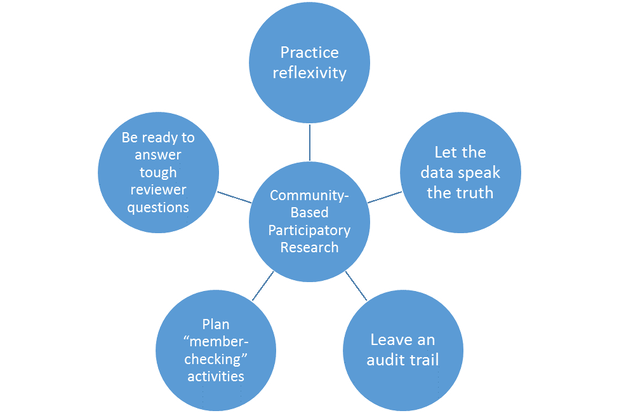
Community-based research (CBR) has established itself as an effective way to engage participants and to get to the “truth” of the phenomenon under study, while minimizing the potential biases of researchers. Here, I offer 5 reminders to people who conduct this type of research, based on the experiences acquired in five multiple-year projects from 2015-present.

1) Practice reflexivity
It is an arts (and a science) to strike a balance between being involved with the project and being too involved. A lot of researchers are passionate about the research they do, some of them may have a vested interest in bettering the community they belong to. While this is a core element of CBR, researchers should remain objective and unbiased by “letting the data speak the truth” and “leaving an audit trail”.

2) Let the data speak the truth
From my experience working with researchers (or researcher activists) in the community, it is often observed (by me anyway) that some are so vested in the community that they are allowing their personal perspectives and beliefs to influence the outcomes from the data. For example, cancer treatment advocates may have a sweeping antagonistic view towards all existing government policies, or immigrant supporters may believe that the entire system is treating them unfairly no matter what. Remember, researchers are supposed to be unbiased in their quest to find the truth, and the truth can be found in the data.

3) Leave an audit trail
This means documenting the tactics you have used to demonstrate the results are not subjective and ungrounded. It is especially important when the researcher is intimately involved with the community. For more on how to leave an audit trail, refer to the classic “Constructing Grounded Theory” book written by Dr. Kathy Charmaz (2014). Here are some examples:

-visit the sites on different dates and at different times
-assign multiple data analysts (such as data coders) to “triangulate” the analysis
-calculate percentage agreement and/or Kappa score on coding done by different coders, to establish the  research as “scientific”
-organize “member-checking” meetings with various stakeholders to disseminate results and receive feedback  from the community
-create a table and/or a graph to visualize all the methods used to ensure objectivity

4) Plan “member-checking” activities
This means bringing the preliminary or almost final results back to the stakeholders such as community members directly affected by the issue under study, policymakers, and researchers to be informed and to give feedback. These meetings can happen more than once, for example, one at the halfway point of data collection, and another one when the preliminary results are ready. It is not a mandatory requirement in CBR but the quality and objectiveness of the study will greatly increase when member- checking is built into the research. Keep in mind that this is a time- and labour-intensive process to bring many parties together, so plan well in advance of these meetings.

5) Be ready to answer tough reviewer questions
The nature of CBR means that the research process could be unpredictable and the challenges faced would be unique to each project. Some common ones are an unexpected, prolonged period of data collection, or the difficulty in convening community members to meet to move the project along. Later, when you get to the writing and publishing stage, you may find the reviewers either know about the topic area well, or know about CBR well, but not both. As a result, be prepared to answer questions that may seem irrelevant, especially with regard to the following:

-What are the processes you have picked for YOUR community-based research?
-How did you ensure the data collection, data analysis and results are not biased and subjective? (Hint, the audit trail)
-What are some of the unique challenges in YOUR community-based research and how did you handle them?

Community-based research is not easy to do, but it could be a fun and enriching experience for both the researchers and participants. Remember, the research project lasts only a period of time, but the benefits that it brings to the community can last much longer. Have fun in this journey!


Figure 1 - 5 Tips for Conducting Community-Based Participatory Research

References
Charmaz, K. (2014). Constructing Grounded Theory (2nd edition). Thousand Oaks, CA: Sage Publications.

0 Comments

How to Effectively Visualize Your Project in a Graph – An Example

7/6/2019

0 Comments

 
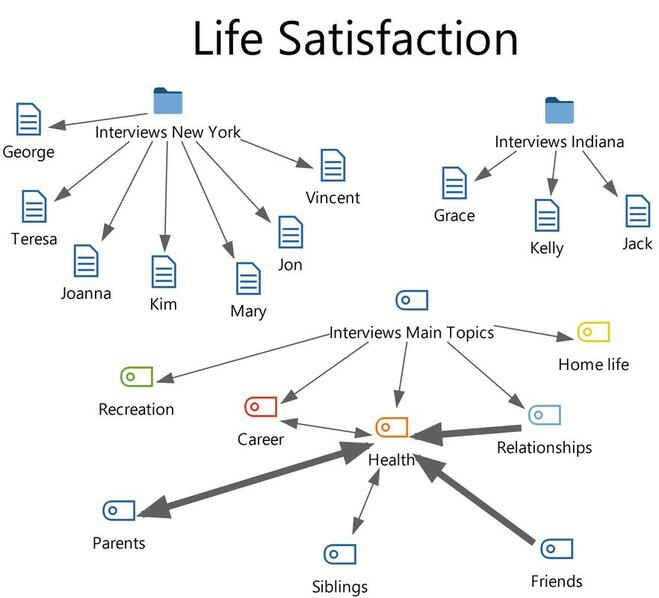
Whether it be a presentation, a poster or a project meeting, showing your materials visually has the potential to greatly increase the level of understanding. In fact, all three software I teach (i.e., MAXQDA, NVivo, ATLAS.ti) have built-in functions to easily accomplish this. Let us look at an example using the MAXQDA-->Visual Tools-->MAXMaps function.

Please note that I created this MAXMap from the example project in just minutes. With practice, you can also create a graph to represent aspects of your project within minutes!
Picture
Looking at this graph with minimal words, readers can get a LOT of information:

i) Study topic: Obviously the research topic is Life Satisfaction as the header suggests!
ii) Source documents: The main documents are a total of 10 interviews from New York and Indiana.
iii) Main themes: Coding and data analysis result in 5 major themes that affect life satisfaction (recreation, career, health, relationships and home life).
iv) Subtopics under Health: The theme Health is subdivided into parents, siblings and friends.
v) Direction of links: The links tell you important information about the relations among the themes. For example, relationships lead to health, career is associated with health with no causal relationship.
vi) Thickness of links: The strength of the relations is also visualized in the links. For instance, parents and friends are stronger indicators of health compared to siblings.
 
Last pointer: This graph may look simple but it does give readers a holistic view of the project and results. Just remember not to put too many objects into the graph or else it will look “too busy” to be understood!
0 Comments

Transcription for Research Success – Most Common Mistakes and What You Should Do Instead

6/29/2019

0 Comments

 
In the last four years of offering software training (MAXQDA, ATLAS.ti, NVivo), one of the top three topics participants ask about is transcription. As such, I have compiled the following questions and answers to guide users’ decisions should they find themselves facing the same doubts.

Q 1: Should I transcribe audio and video files outside of the software, or import them into the software and transcribe within?
A: In general, transcription done outside of research software using a program specifically for transcribing is easier. You can add timestamps when you transcribe either outside or within. One advantage of transcribing within is that the documents will be fully formatted for that software (e.g., MAXQDA, NVivo), but a disadvantage is that the audio or video files take up too much space in your project and may slow it down.
 
Q2: Do I add timestamps to my transcripts?
A: There is no need to add timestamps to your transcripts if you are never going to use them to pinpoint the exact locations on the audio or video files. If you will only analyze the text of your interviews or focus groups or meetings, you will ensure that the transcriptions are accurate and do NOT have to refer back to the audio or video files using timestamps.    
 
Q3: How should I transcribe interviews or focus groups or conference sessions or webinars or clinical visits, etc.?
A: Each research program has specific requirements on how it will recognize the different data sources when you import them. Be sure to check the manuals of the respective program you are using (MAXQDA, ATLAS.ti, NVivo) before transcribing. This ensures the program can understand what data it is and import it as such.
 
Q4: Do I transcribe all data sources, or just some of them?
A: This is a rigor question. Due to a limited budget or time, you might choose to selectively transcribe your data for analysis. However, this also introduces biases early on in data analysis because some data is already deemed irrelevant and therefore not transcribed. In cases where you actually code the audio or video files directly in a research program, there may not be any need to transcribe them into text.
 
Q5: What about the new NVivo auto-transcription feature (released 2019)? Doesn’t it take away the necessity to transcribe manually?
A: This may also be a rigor issue. As of today, this new NVivo feature works best with audio files “with high quality” and the results are “up to 90 percent accurate”. Yes, this feature is significantly cheaper and faster than manual transcription, but it is also far from perfect (like you would expect from human transcriptionists) at the moment. Also, the auto-transcripts will be formatted for use in NVivo only.
0 Comments

Intercoder Agreement and Kappa Score with Qualitative Data – Tips and Tricks

6/29/2019

0 Comments

 
Despite the existence of functions to calculate percentage agreement and Kappa score on coding done by two or more coders in various software programs, there remains few published resources discussing this approach to qualitative data analysis. For the actual STEPS in coding and generating the percentages and scores, please refer to the references at the end. Here, I share some pointers after adopting this approach and interpreting the results in a full year project with in-depth interview data with three coders.   

Important considerations:
  1. Ensure the coding framework for different coders is the same or largely the same if you merge projects. Otherwise, percentage agreement or Kappa score will not be generated/will be meaningless for codes/nodes that exist only in one project.
  2. Set rules on how much text to code, for example, whole paragraphs, sentences or just the key words. The percentages and scores will always be low if different coders select different amount of text.
  3. Do not rely solely on the generated numbers to decide on the degree of agreement. Always click on the results to see the text in the original transcripts and discuss the codes/nodes that are divergent.   
  4. Do not get stuck on arriving at a high or perfect percentage agreement or Kappa. It is easy to get caught up in the process while losing sight of the purpose of this approach. If in doubt, refresh your memory on “Differences between Qualitative and Quantitative Research 101”.
  5. Remember, calculating percentage agreement and Kappa score with qualitative coding is a controversial topic. Some argue that it is imposing a quantitative mindset on qualitative data. Be extra cautious!

Pros of this approach:
  1. For the quantitative mind, the numbers provide reassurance that the resulting themes or theories are objective and rigorous.
  2. It provides a systematic way to eliminate codes/nodes that fall below a threshold percentage or score.
  3. Scientists love this! Some believe that any results not backed up by numbers and statistics are subjective and anecdotal.

Cons of this approach:
  1. It could take away the power of interpretation and data immersion, which are the fundamentals in qualitative analysis, if all the results need to be quantified.
  2. It is more time-consuming than other analysis methods, especially in setting up precise coding rules, merging projects, generating numbers and discussing the results.
  3. There is little published work on this topic. Researchers are often left on their own to figure out how to apply it in their projects.

Resources*
ATLAS.ti 8 Online HowTo Documents – Inter-Coder Agreement Analysis with ATLAS.ti 8 Windows. (2019). https://atlasti.com/manuals-docs/
MAXQDA 2018 Online Manual: Chapter 24 - Teamwork - Intercoder Agreement. (2019). https://www.maxqda.com/help-max18/teamwork/problem-intercoder-agreement-qualitative-research
NVivo 12 for Windows Online Help - Coding Comparison Query. (2019). https://help-nv.qsrinternational.com/12/win/v12.1.82-d3ea61/Content/queries/coding-comparison-query.htm
 
*I am not satisfied with the few work detailing this approach in the current literature and therefore have excluded them from this Resources list.
0 Comments
<<Previous

    Author

    This blog is a space to record my thoughts and experiences. Much like field notes and participant observations, if I don't write, I forget!
    In time, this blog will become a "goldmine" to "dig" for my evolving experiences.   

    Archives

    June 2020
    December 2019
    July 2019
    June 2019
    December 2017
    July 2016
    December 2015
    August 2015
    December 2014
    November 2014

    Categories

    All

Powered by Create your own unique website with customizable templates.